Spearman's rank correlation coefficient
In statistics, Spearman's rank correlation coefficient or Spearman's rho, named after Charles Spearman and often denoted by the Greek letter  (rho) or as
  , is a non-parametric measure of statistical dependence between two variables. It assesses how well the relationship between two variables can be described using a monotonic function. If there are no repeated data values, a perfect Spearman correlation of +1 or −1 occurs when each of the variables is a perfect monotone function of the other.
Contents |
Definition and calculation
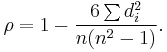
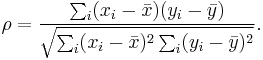
The Spearman correlation coefficient is often thought of as being the Pearson correlation coefficient between the ranked variables. In practice, however, a simpler procedure is normally used to calculate ρ. The n raw scores Xi, Yi are converted to ranks xi, yi, and the differences di = xi − yi between the ranks of each observation on the two variables are calculated.
If there are no tied ranks, then ρ is given by:[1][2]
If tied ranks exist, Pearson's correlation coefficient between ranks should be used for the calculation[1]:
One has to assign the same rank to each of the equal values. It is an average of their positions in the ascending order of the values.
An example of averaging ranks
In the table below, notice how the rank of values that are the same as the mean of what their ranks would otherwise be.
Variable  |
Position in the descending order | Rank  |
|---|---|---|
| 0.8 | 5 | 5 |
| 1.2 | 4 |  |
| 1.2 | 3 | |
| 2.3 | 2 | 2 |
| 18 | 1 | 1 |
Interpretation

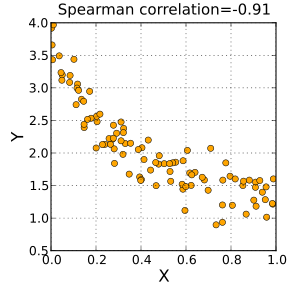
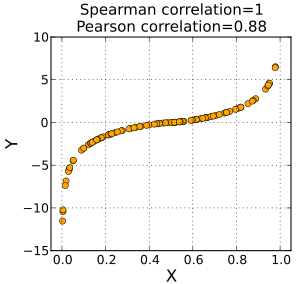
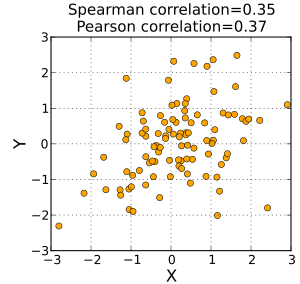
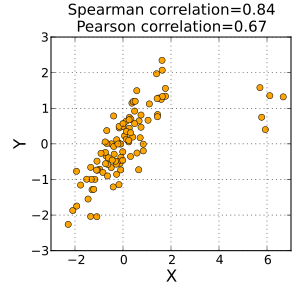
The sign of the Spearman correlation indicates the direction of association between X (the independent variable) and Y (the dependent variable). If Y tends to increase when X increases, the Spearman correlation coefficient is positive. If Y tends to decrease when X increases, the Spearman correlation coefficient is negative. A Spearman correlation of zero indicates that there is no tendency for Y to either increase or decrease when X increases. The Spearman correlation increases in magnitude as X and Y become closer to being perfect monotone functions of each other. When X and Y are perfectly monotonically related, the Spearman correlation coefficient becomes 1. A perfect monotone increasing relationship implies that for any two pairs of data values Xi, Yi and Xj, Yj, that Xi − Xj and Yi − Yj always have the same sign. A perfect monotone decreasing relationship implies that these differences always have opposite signs.
The Spearman correlation coefficient is often described as being "nonparametric." This can have two meanings. First, the fact that a perfect Spearman correlation results when X and Y are related by any monotonic function can be contrasted with the Pearson correlation, which only gives a perfect value when X and Y are related by a linear function. The other sense in which the Spearman correlation is non-parametric is that its exact sampling distribution can be obtained without requiring knowledge of the joint probability distribution of X and Y.
Example
In this example, we will use the raw data in the table below to calculate the correlation between the IQ of a person with the number of hours spent in front of TV per week.
| IQ, |
Hours of TV per week,  |
| 106 | 7 |
| 86 | 0 |
| 100 | 27 |
| 101 | 50 |
| 99 | 28 |
| 103 | 29 |
| 97 | 20 |
| 113 | 12 |
| 112 | 6 |
| 110 | 17 |
First, we must find the value of the term  . To do so we use the following steps, reflected in the table below.
- Sort the data by the first column (). Create a new column and assign it the ranked values 1,2,3,...n.
- Next, sort the data by the second column (). Create a fourth column
 and similarly assign it the ranked values 1,2,3,...n.
 - Create a fifth column
 to hold the differences between the two rank columns ( and ).
 - Create one final column to hold the value of column squared.
| IQ, |
Hours of TV per week, |
rank |
rank |
|
|
| 86 | 0 | 1 | 1 | 0 | 0 |
| 97 | 20 | 2 | 6 | −4 | 16 |
| 99 | 28 | 3 | 8 | −5 | 25 |
| 100 | 27 | 4 | 7 | −3 | 9 |
| 101 | 50 | 5 | 10 | −5 | 25 |
| 103 | 29 | 6 | 9 | −3 | 9 |
| 106 | 7 | 7 | 3 | 4 | 16 |
| 110 | 17 | 8 | 5 | 3 | 9 |
| 112 | 6 | 9 | 2 | 7 | 49 |
| 113 | 12 | 10 | 4 | 6 | 36 |
With found, we can add them to find 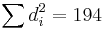 . The value of n is 10. So these values can now be substituted back into the equation,
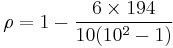
which evaluates to ρ = −0.175757575...
This low value shows that the correlation between IQ and hours spent watching TV is very low. In the case of ties in the original values, this formula should not be used. Instead, the Pearson correlation coefficient should be calculated on the ranks (where ties are given ranks, as described above).
Determining significance
One approach to testing whether an observed value of ρ is significantly different from zero (r will always maintain 1 ≥ r ≥ −1) is to calculate the probability that it would be greater than or equal to the observed r, given the null hypothesis, by using a permutation test. An advantage of this approach is that it automatically takes into account the number of tied data values there are in the sample, and the way they are treated in computing the rank correlation.
Another approach parallels the use of the Fisher transformation in the case of the Pearson product-moment correlation coefficient. That is, confidence intervals and hypothesis tests relating to the population value ρ can be carried out using the Fisher transformation:
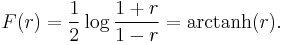
If F(r) is the Fisher transformation of r, the sample Spearman rank correlation coefficient, and n is the sample size, then
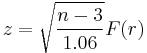
is a z-score for r which approximately follows a standard normal distribution under the null hypothesis of statistical independence (ρ = 0).[3][4]
One can also test for significance using
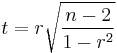
which is distributed approximately as Student's t distribution with n − 2 degrees of freedom under the null hypothesis.[5] A justification for this result relies on a permutation argument.[6]
A generalization of the Spearman coefficient is useful in the situation where there are three or more conditions, a number of subjects are all observed in each of them, and it is predicted that the observations will have a particular order. For example, a number of subjects might each be given three trials at the same task, and it is predicted that performance will improve from trial to trial. A test of the significance of the trend between conditions in this situation was developed by E. B. Page[7] and is usually referred to as Page's trend test for ordered alternatives.
Correspondence analysis based on Spearman's rho
Classic correspondence analysis is a statistical method which gives a score to every value of two nominal variables, in this way that Pearson's correlation coefficient between them is maximized.
There exists an equivalent of this method, called grade correspondence analysis, which maximizes Spearman's rho or Kendall's tau[8].
See also
- Kendall tau rank correlation coefficient
- Rank correlation
- Chebyshev's sum inequality, rearrangement inequality (These two articles may shed light on the mathematical properties of Spearman's ρ.)
- Pearson product-moment correlation coefficient, a similar correlation method that measures the "linear" relationships between the raw numbers rather than between their ranks.
References
- ↑ 1.0 1.1 Myers, Jerome L.; Arnold D. Well (2003). Research Design and Statistical Analysis (second edition ed.). Lawrence Erlbaum. pp. 508. ISBN 0805840370.
- ↑ Maritz. J.S. (1981) Distribution-Free Statistical Methods, Chapman & Hall. ISBN 0-412-15940-6. (page 217)
- ↑ Choi, S.C. (1977) Test of equality of dependent correlations. Biometrika, 64 (3), 645–647
- ↑ Fieller, E.C. et al (1957) Tests for rank correlation coefficients :I. Biometrika 44, 470–481
- ↑ Press, Vettering, Teukolsky, and Flannery (1992) Numerical Recipes in C: The Art of Scientific Computing, 2nd Edition, page 640
- ↑ Kendall, M.G., Stuart, A. (1973)The Advanced Theory of Statistics, Volume 2: Inference and Relationship, Griffin. ISBN 0852642156 (Sections 31.19, 31.21)
- ↑ Page, E. B. (1963). "Ordered hypotheses for multiple treatments: A significance test for linear ranks". Journal of the American Statistical Association 58: 216–230. doi:10.2307/2282965.
- ↑ Kowalczyk, T.; Pleszczyńska E. , Ruland F. (eds.) (2004). Grade Models and Methods for Data Analysis with Applications for the Analysis of Data Populations. Studies in Fuzziness and Soft Computing vol. 151. Berlin Heidelberg New York: Springer Verlag. ISBN 9783540211204.
- G.W. Corder, D.I. Foreman, "Nonparametric Statistics for Non-Statisticians: A Step-by-Step Approach", Wiley (2009)
- C. Spearman, "The proof and measurement of association between two things" Amer. J. Psychol. , 15 (1904) pp. 72–101
- M.G. Kendall, "Rank correlation methods" , Griffin (1962)
- M. Hollander, D.A. Wolfe, "Nonparametric statistical methods" , Wiley (1973)
- J. C. Caruso, N. Cliff, "Empirical Size, Coverage, and Power of Confidence Intervals for Spearman's Rho", Ed. and Psy. Meas. , 57 (1997) pp. 637–654
External links
- Table of critical values of ρ for significance with small samples
- Spearman's rank online calculator
- Chapter 3 part 1 shows the formula to be used when there are ties
- Spearman's rank correlation: Simple notes for students with an example of usage by biologists and a spreadsheet for Microsoft Excel for calculating it (a part of materials for a Research Methods in Biology course).
|
|||||||||||||||||||||||||||||||||||||||||||||||||||||||||||||||||||||||||||||||||||||||||||||||||||||||||||||||||||||||||||||||||||||||||